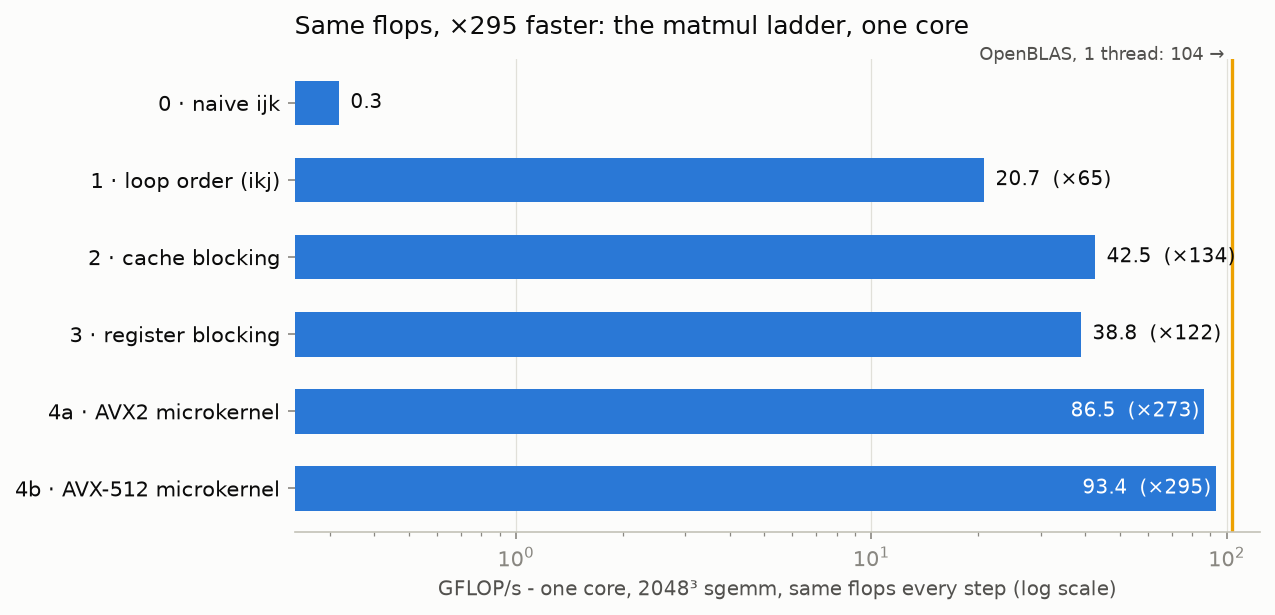
Every kernel in this post computes the exact same 17 billion floating-point operations on the same matrices. The fastest single-core version runs 295× faster than the slowest - without removing a single flop. This is a tour of where that factor lives: the cache hierarchy, and loops that respect it.
Take the matrix multiplication everyone writes first - three nested loops - and run it on a modern server core (AMD EPYC 9454, Zen 4): 0.32 GFLOP/s. One 2048³ multiply takes 54 seconds. The same core, running code with the same flops but a different memory choreography, does it in 0.18 seconds. Nothing in the naive loop is “wrong”: the flops are the flops. What’s wrong is the order the bytes are asked to arrive in - and on a CPU, byte order is nearly everything.
We’ll climb there one step at a time, measuring each step (GFLOP/s and
hardware cache-miss counters), on one pinned core of a 144-vCPU box, gcc 13
with -O3 -march=native throughout - so every speedup you’ll see comes from
code structure, not compiler flags.
Your CPU is a memory device that occasionally computes
A core computes only from registers: the FMA units can retire 32 single-precision flops per cycle, but only on operands already in hand. Everything else is a supply chain, and you should know its prices. Not from a textbook - measured on this exact machine, with a pointer-chase microbenchmark (each load’s address depends on the previous load, so nothing can be overlapped or prefetched - pure latency):
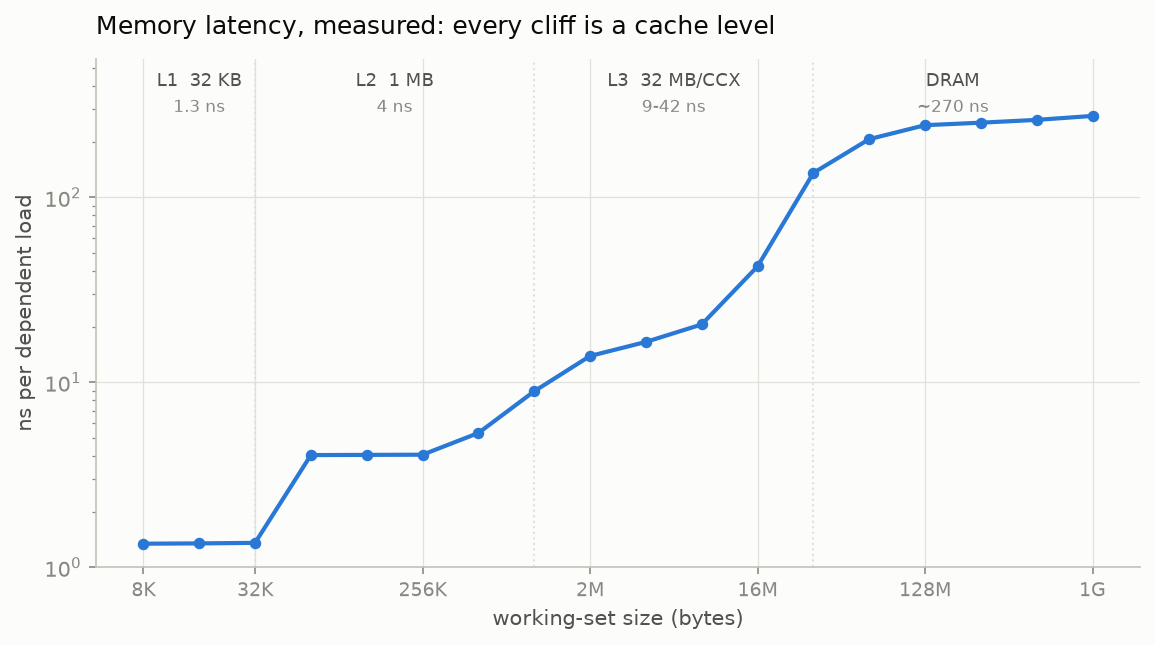
| level | size (measured) | latency (measured) |
|---|---|---|
| L1d | 32 KB | 1.3 ns (~5 cycles) |
| L2 | 1 MB | 4 ns |
| L3 | 32 MB per 8-core complex | 9-42 ns |
| DRAM | - | ~270 ns |
Two things worth pausing on. First, the spread: DRAM costs ~200× more
than L1 per dependent access. Second: this VM’s lscpu reports fictional
cache sizes (KVM guests often do - it claims 64 KB of L1 and a “2.3 GiB
L3”). The staircase doesn’t lie; the cliffs sit exactly at Zen 4’s real
32 KB / 1 MB / 32 MB boundaries. Measure, don’t trust.
Streaming bandwidth tells the other half: one core pulls about 14 GB/s from DRAM, and all 144 threads together top out near 290 GB/s - 144× the compute, but only 21× the bandwidth. Cores multiply; the memory bus doesn’t. Keep that asymmetry in mind for the threading steps later.
Why matmul is the perfect specimen
C = A·B at 2048³ does 2·2048³ ≈ 17.2 GFLOP on 48 MB of matrices. That’s
the interesting property: O(N³) work on O(N²) data - each element of A
and B is needed 2048 times. Whether it’s fetched from DRAM 2048 times or
twice is entirely up to the loop structure. Arithmetic intensity - flops per
byte moved - is not fixed by the algorithm; it’s chosen by the
implementation. Naive code chooses ~1 flop/byte and inherits the memory
system’s speed. Blocked code chooses hundreds and inherits the FMA units’.
So the entire post is one sentence: move each byte up the hierarchy once, then use it many times before letting it fall back down.
Step 0 - the loop everyone writes first
for (int i = 0; i < M; i++)
  for (int j = 0; j < N; j++)
    for (int k = 0; k < K; k++)
      C[i*N + j] += A[i*K + k] * B[k*N + j];
0.32 GFLOP/s. The killer is B[k*N + j] with k innermost: consecutive
iterations touch B one full row apart - an 8 KB stride. Every access opens a
fresh 64-byte cache line, uses 4 bytes of it, and the line is evicted
long before the next column pass could reuse it. The counters agree: 42%
of all L1 loads miss. And there’s a second, quieter penalty: a
strided reduction is something the compiler can’t vectorize, so this runs as
scalar code on a machine with 16-lane FMA units.
Step 1 - same flops, different spelling
Three loops permute six ways. Same arithmetic, same result - six different access patterns. Here’s what the two extreme spellings ask the cache to do:
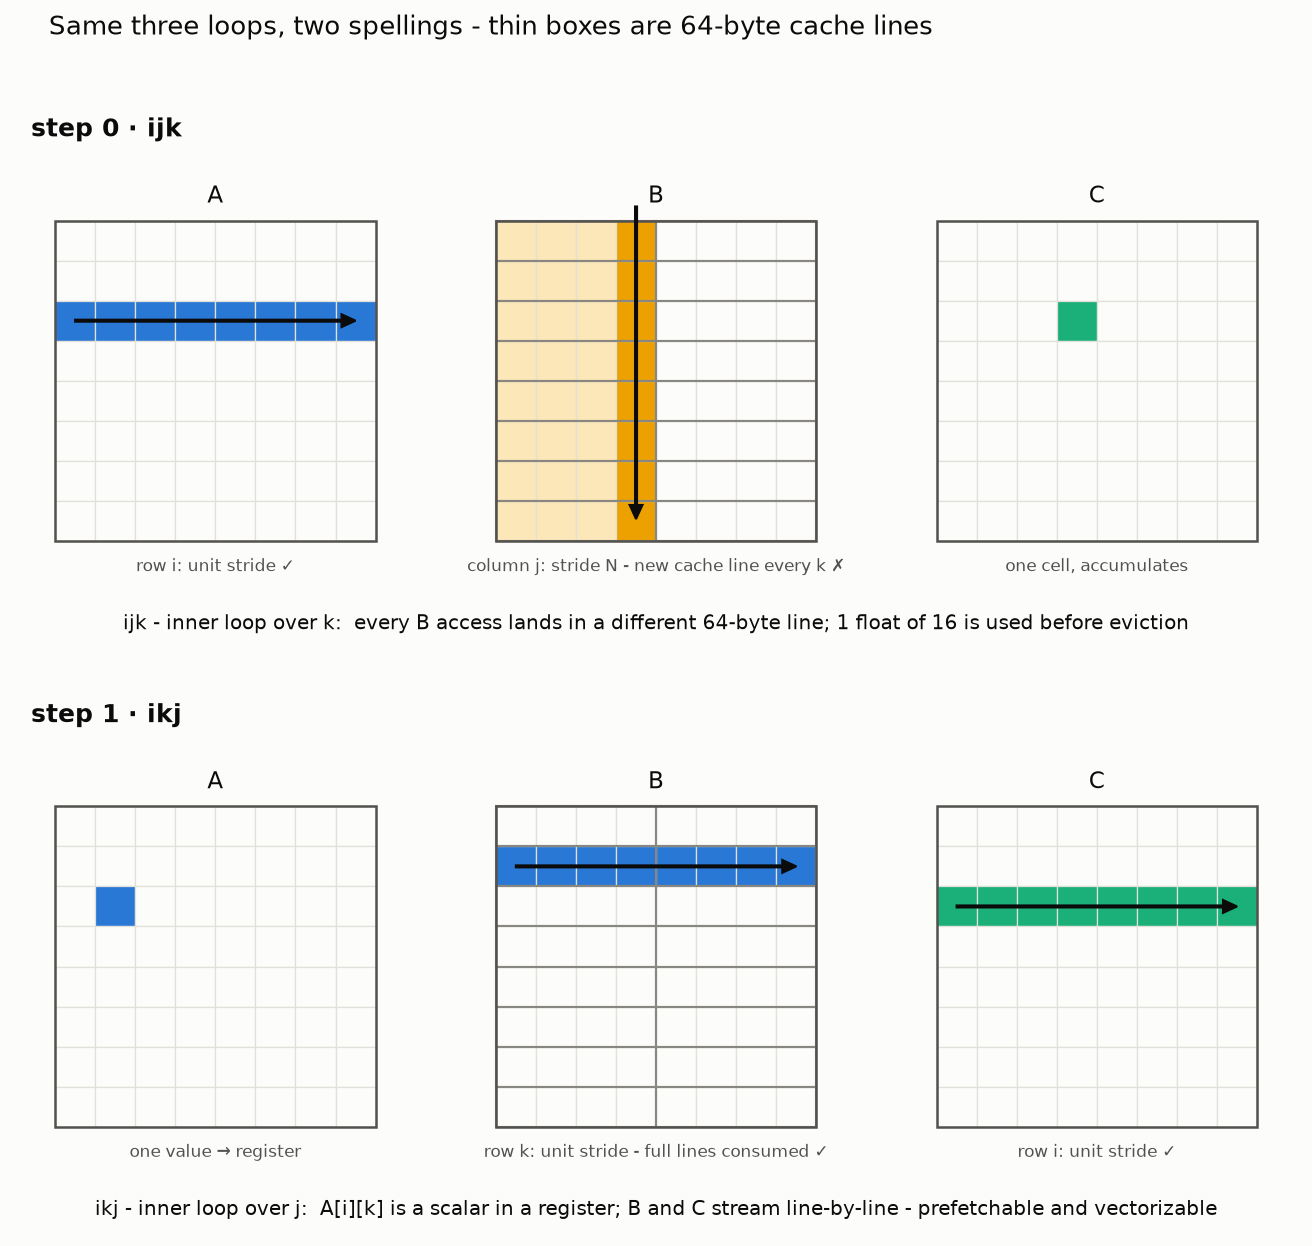
In ikj (bottom), A[i][k] becomes a scalar parked in a register, and both
B and C stream left-to-right through consecutive cache lines: every byte
fetched is a byte used, the prefetcher recognizes the sequential walk and
runs ahead, and the inner loop is exactly the shape the compiler knows how
to vectorize.
for (int i = 0; i < M; i++)
  for (int k = 0; k < K; k++) {
    float a = A[i*K + k];            // scalar, reused across the j loop
    for (int j = 0; j < N; j++)
      C[i*N + j] += a * B[k*N + j];  // unit stride through B and C
  }
20.7 GFLOP/s - ×65 from swapping two lines. All six orders, measured:
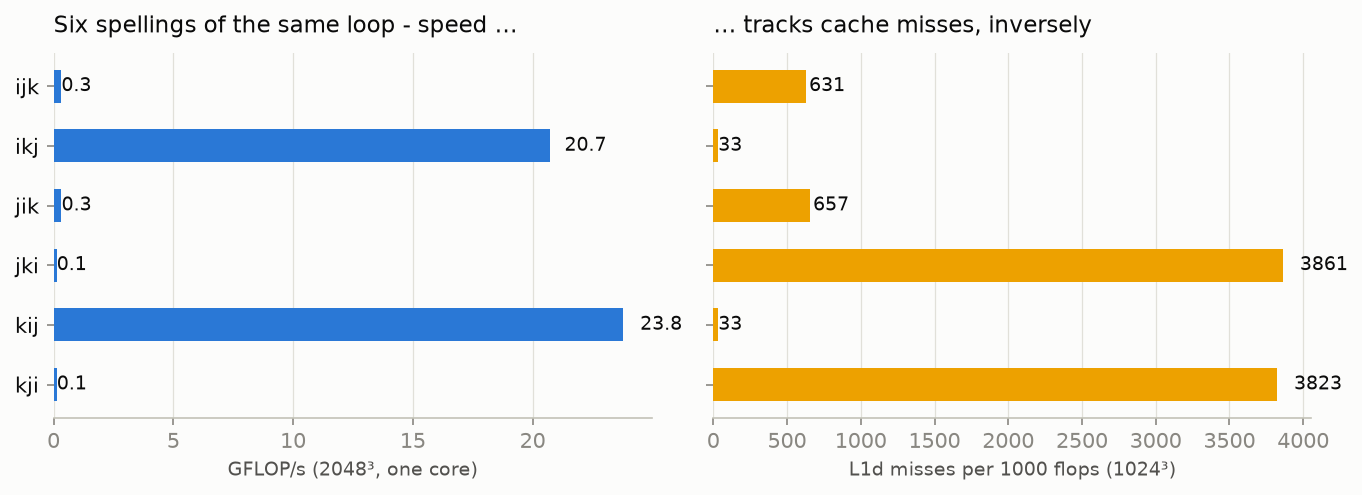
| inner loop | orders | GFLOP/s | L1 misses / kflop | IPC |
|---|---|---|---|---|
j (unit stride) |
ikj, kij | 20.7 / 23.8 | 33 | 1.8 |
k (B strided) |
ijk, jik | 0.32 / 0.32 | 631 | 0.6 |
i (A and C strided) |
jki, kji | 0.13 | 3,861 | 0.15 |
The orders pair exactly by their inner loop - the outer order barely
matters. And notice the instruction counts hiding in the IPC column: the
j-inner versions execute 18× fewer instructions for the same flops
(481M vs 8.7B), because the compiler vectorized them. Access pattern and
vectorizability aren’t two separate optimizations; the same loop shape buys
you both - or costs you both. The worst order, jki, strides through two
arrays at once and manages 2.7 misses per load: at 2048³ it runs 135
seconds - the same flops ikj finishes in 0.83.
Step 2 - tiling: make the working set fit
ikj fixed the shape of each access, but not the amount of reuse: by
the time row i+1 wants the same rows of B again, all 16 MB of B have
marched through the cache and evicted themselves. The reuse the algorithm
promises never physically happens.
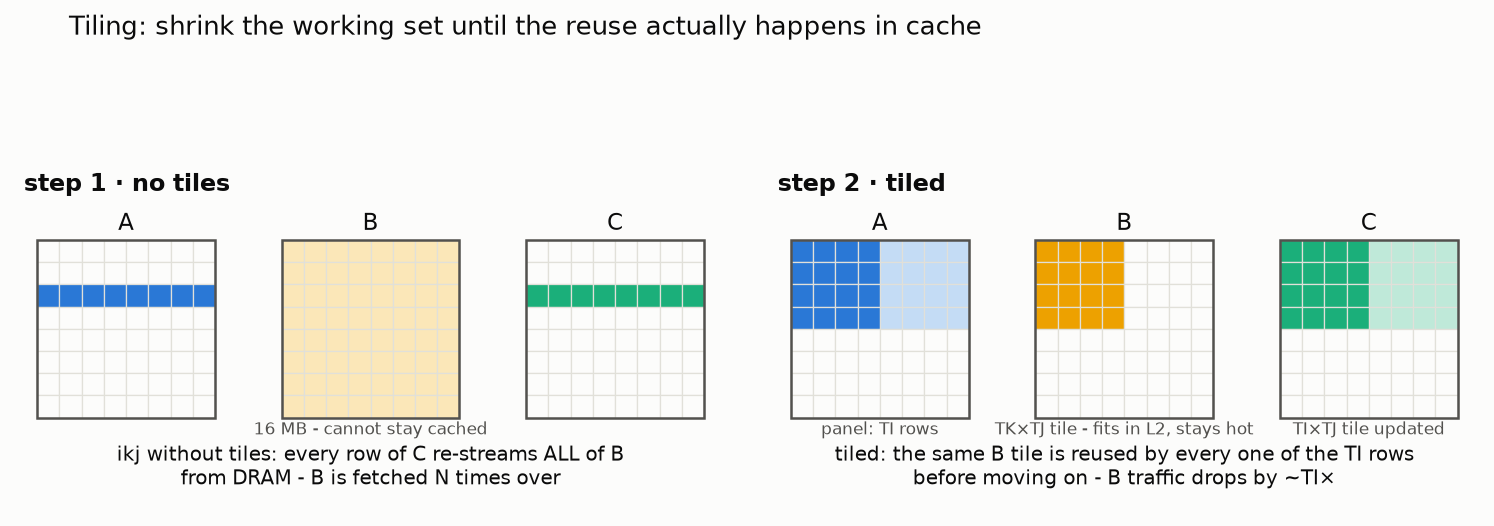
Tiling is the fix: break the loops into blocks so a TK×TJ tile of B fits
in L2 and stays there while a TI-row panel of A sweeps over it. Each B
byte is fetched from DRAM once per tile pass instead of once per C row:
for (int ii = 0; ii < M; ii += TI)     // block the loops...
  for (int kk = 0; kk < K; kk += TK)
    for (int jj = 0; jj < N; jj += TJ)
      /* ...then run ikj inside the (TI × TK × TJ) block */
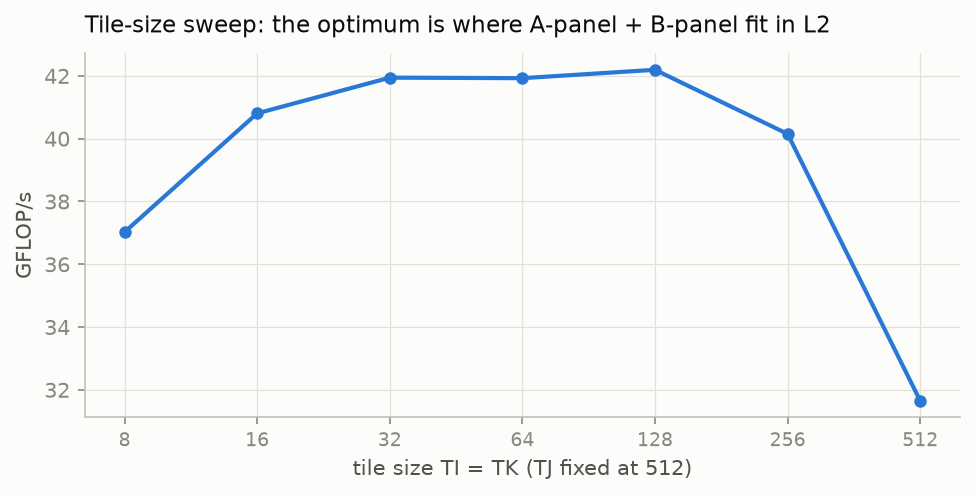
42.5 GFLOP/s (×134). And the tile-size sweep is the hierarchy speaking
directly: performance plateaus while the B tile + A panel fit in the 1 MB
L2, and falls off a cliff (-25%) at TI = 512, where the tile alone is
1 MB:
Step 3 - a humbling interlude: the compiler was already here
The next classical step is register blocking: compute a small tile of C in local variables so each loaded value feeds multiple accumulations. I wrote the textbook version - a 4×16 C tile in plain C, j-loop innermost so it stays vectorizable - and measured… 38.8 GFLOP/s. A wash with step 2.
Two honest lessons from this step. First: my initial version used the
other textbook formulation (4×4 tile, dot-product style, k innermost) and
ran 4× slower than step 2 - a k-inner reduction with strided B kills
auto-vectorization, same as step 0. Register blocking that breaks
vectorization is negative-value work. Second: once the loop is
vectorizable, gcc at -O3 -march=native was already register-blocking it
behind your back - the plain-C hint adds nothing. The compiler got us to 42.
To go further you can’t hint; you have to say what you mean.
Step 4 - SIMD: say what you mean
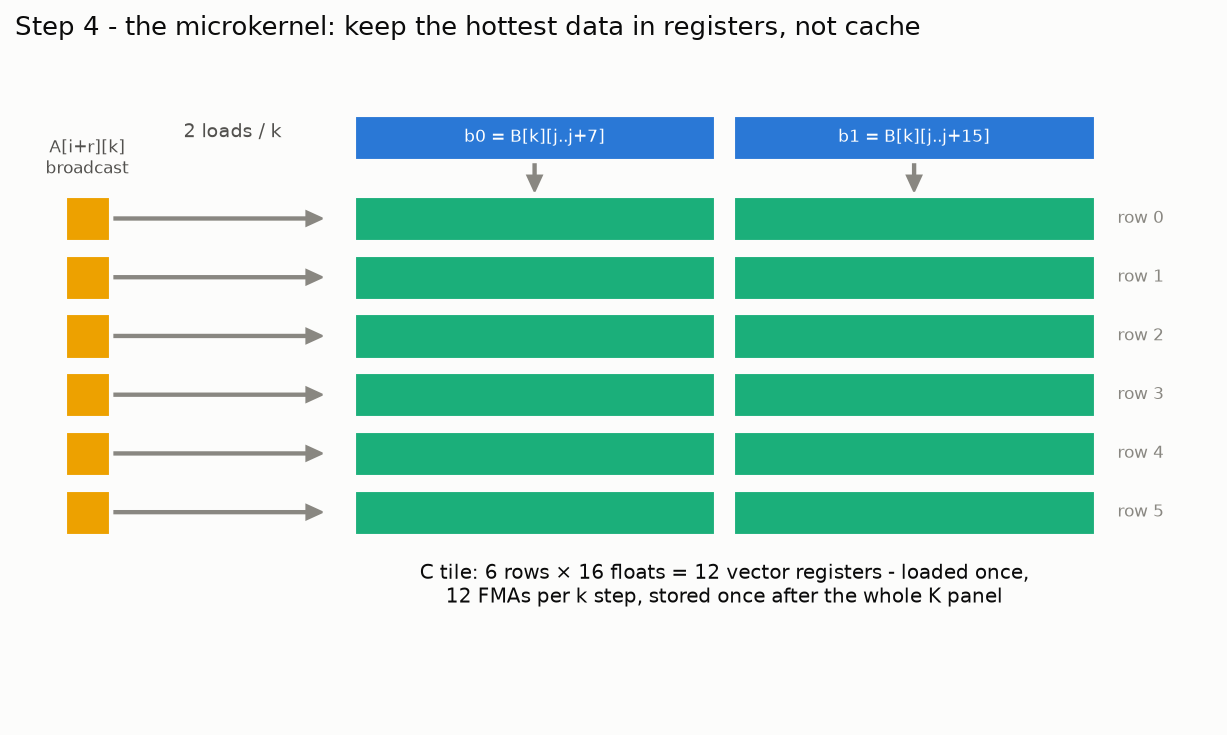
The microkernel pins a 6×16 tile of C in 12 vector registers for the entire K panel. Per k step: two loads pull a slice of B’s row, six broadcasts pull a column sliver of A, twelve FMAs update the tile. C touches memory exactly twice - one load, one store - regardless of K. The innermost loop now does 12 FMAs per 2 loads; the FMA units, not the cache, become the bottleneck. That inversion - compute-bound at last - is the point of the whole ladder.
__m256 c[6][2];                       // the C tile: 12 ymm registers
for (int k = 0; k < kc; k++) {
  __m256 b0 = _mm256_loadu_ps(B + k*N);        // 2 loads
  __m256 b1 = _mm256_loadu_ps(B + k*N + 8);
  for (int r = 0; r < 6; r++) {
    __m256 a = _mm256_set1_ps(A[r*K + k]);     // broadcast
    c[r][0] = _mm256_fmadd_ps(a, b0, c[r][0]); // 12 FMAs
    c[r][1] = _mm256_fmadd_ps(a, b1, c[r][1]);
  }
}
AVX2: 86.5 GFLOP/s (×273). AVX-512 (same kernel, zmm registers): 93.4 (×295) - 79% of this core’s theoretical FP32 peak, and within 10% of OpenBLAS single-threaded (103.6). The counters close the loop on the story: misses per kflop fell from 631 (step 0) to 7, and the AVX-512 version retires the same work in 190M instructions - 46× fewer than the naive loop. (Zen 4 “double-pumps” 512-bit ops through 256-bit units, so AVX-512’s edge here is register count and fewer instructions, not raw FLOP rate.)
That number is at the default block sizes. A short sweep of the two tile
parameters - no new idea, just TJ=128, TK=512 - takes the same 6×32 kernel
to ~100 GFLOP/s, ~96% of OpenBLAS. So of the residual single-core gap,
most is the untuned tiling around the kernel, not the kernel itself.
Aside: “did you try unrolling?”
Explicitly, yes - and it’s a good example of an optimization whose moment has
passed by this point on the ladder. Unrolling pays when a loop is limited by
branch overhead or doesn’t expose enough independent work; it does nothing
when the execution units are already saturated. Measured: -funroll-loops
speeds up the naive vectorizable loop by +27% (step 1 material), is flat on
the tiled loops, and makes the intrinsics kernels slower (-16% on the AVX2
one - bigger loop body, no bottleneck removed). Manually unrolling the
AVX-512 microkernel’s k loop by 4 (avx512u in the repo): -4%. The
microkernel already keeps 12 independent FMA chains in flight, and the
register tile itself is an unroll of the i and j loops - the technique is
baked into steps 3 and 4, so applying it again just adds bytes to the loop
body.
Step 5 - threads: many cores, one memory bus
Parallelizing a blocked matmul looks trivial - C’s rows are independent, so hand each thread a slice. My first version handed out slices of 6 rows (one microtile) for load balance… and single-thread throughput collapsed from 93 to 19 GFLOP/s. Why: inside each tiny slice, every B tile gets loaded, used for just 6 rows, and evicted - the decomposition had quietly destroyed step 2. The fix is one contiguous row-panel per thread, so each thread keeps the full single-core blocking structure. Thread decomposition is a cache decision before it’s a scheduling decision.
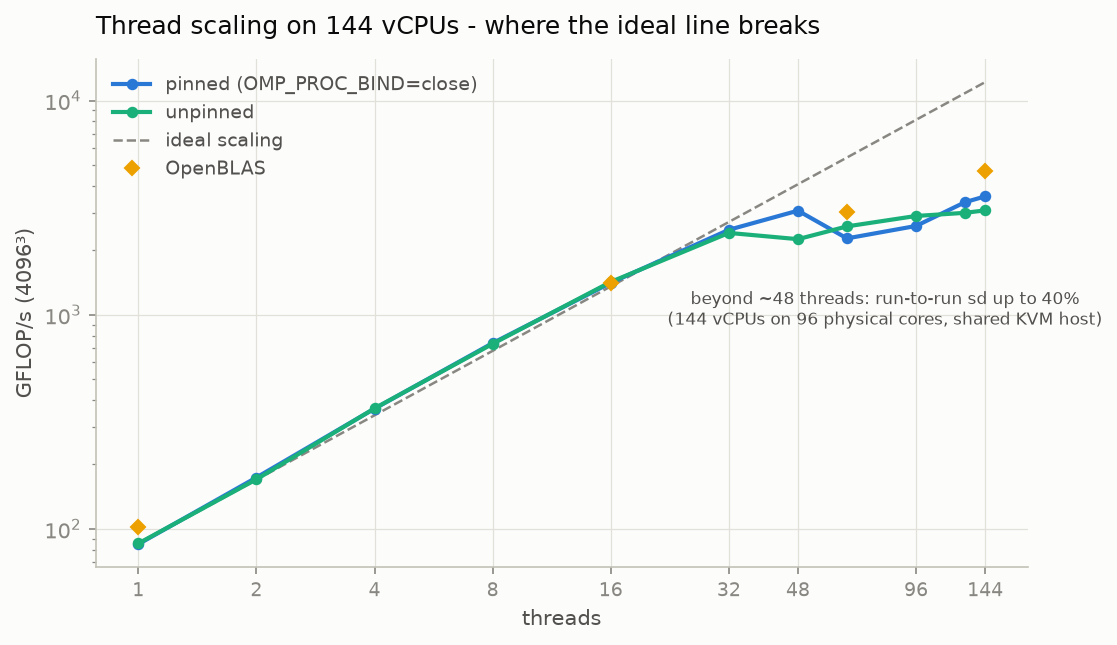
With that fixed, scaling at 4096³ is near-ideal up to 48 threads: ×16.6 at 16 threads (1.41 TFLOP/s), ×36 at 48 (3.06 TFLOP/s). Beyond that the curve goes flat and noisy - run-to-run deviation reaches 40% - and that’s its own lesson: this is a 144-vCPU guest on 96 physical cores of a shared hypervisor. Past the physical core count you’re not benchmarking your code anymore; you’re benchmarking the host’s scheduler. (OpenBLAS, same conditions, peaks at 4.7 TFLOP/s - the gap to us is packing plus a smarter 2-D decomposition, and it rides the same noise.)
Step 6 - pinning: stop moving my caches
Everything on this ladder lives in per-core caches - and by default the
OS scheduler feels free to bounce threads between cores, restarting L1 and
L2 from zero on every migration. The scaling plot shows both variants: with
OMP_PROC_BIND=close OMP_PLACES=cores versus letting threads float. The
clearest read is at 48 threads: pinned 3065 GFLOP/s with 0.1% deviation;
unpinned 2255 with 28%. Pinning didn’t just add a third - it made the
number repeatable. If you benchmark anything multithreaded without
pinning, you’re sampling a distribution and calling it a measurement.
On a bare-metal multi-socket box this step grows teeth: memory pages live on the socket that first touched them (first-touch policy), so an unpinned thread can end up doing every load across the socket interconnect. That’s the NUMA story - same principle as everything above, one level further out: keep the data next to the compute. This VM exposes a single NUMA node, so what remains visible here is the affinity half.
The ceiling: what OpenBLAS still knows that we don’t
So what’s actually left? It depends on the regime - and the two variants in the repo (the 6×32 kernel above and a packed one that copies tiles into contiguous buffers) make it measurable:
- One core, compute-bound: packing is nearly a wash. The packed variant tops out at ~104 GFLOP/s single-threaded, only ~4% above the tuned 6×32 kernel. A single core keeps its working set in cache, so there’s no DRAM traffic left to save. Tuning the block sizes already bought almost everything.
- Many cores, memory-bound: packing is the whole difference. OpenMP over row-panels at 4096³, 64 threads: the plain 6×32 version runs ~2.4 TFLOP/s; the version where all threads read one shared packed B panel per (kk,jj) runs ~3.0 TFLOP/s - +25%. The same two kernels are only 4% apart at one core and 25% apart at 64 threads, so the gap that opens as cores pile up is a memory-traffic effect, not an arithmetic one.
That’s the mechanism behind OpenBLAS’s packaging. (LLC and DRAM byte counters aren’t exposed on this KVM guest, so this is read off the scaling curve - the gap that opens between 1 and 64 threads - not a measured miss count.)
OpenBLAS still gets to ~4.7 TFLOP/s at 144 threads, which we don’t match: it uses every thread and a block-cyclic 2-D decomposition. But that’s the same idea one level further out - move each byte once, use it many times.
Takeaways
- The flops never changed. From 0.13 to 93 GFLOP/s on one core - a ×735 spread - purely by changing the order bytes move. On CPUs, matmul is a memory problem long before it’s an arithmetic one.
- The hierarchy is measurable, and worth measuring. 1.3 ns → 4 → 9-42 →
~270: each step of the ladder exists to keep the working set one level
higher. (And in a VM, the measurement beats the spec sheet -
lscpuwas wrong about every cache size.) - Access pattern is the ×65 decision - and it’s free. Loop order determines stride, prefetchability, and vectorizability at once. Check it before anything else.
- The compiler gets you to the L2 step, not past it. Auto-vectorization matched my hand-written register blocking - but the explicit microkernel doubled it. Registers are the one level of the hierarchy the compiler won’t fully manage for you.
- Threads scale what you give them. A decomposition that broke the blocking cost 5× before a single lock or false-share entered the picture; with blocking preserved, 48 threads gave ×36. And past the physical core count on a shared VM, variance (up to 40%) is the measurement - pin your threads and report deviations.
- Packing is a memory-traffic fix, not an arithmetic one. The same two kernels are ~4% apart at one core and ~25% apart at 64 threads. Packing doesn’t make the FMA units faster; it stops many cores from each re-reading B from DRAM. Measure it where it matters (many cores), not where it’s flat (one core).
This ladder - access order, tiling, register microkernels, panel sharing - is exactly the anatomy of every fast GEMM in the wild, from OpenBLAS to the quantized matmul kernels inside llama.cpp. Next time a library README brags about GFLOP/s, you’ll know which step they’re standing on.
Reproduce:
github.com/nguyenhoangthuan99/optimization-diaries -
make && scripts/run_ladder.sh 2048 (gcc 13, -O3 -march=native); the
packing comparison at chip scale is scripts/run_multicore.sh 4096. The
block-size tune behind the “~100 GFLOP/s” single-core figure is the
TJ/TK sweep recorded in data/avx512_tune.csv.
Measured on one AMD EPYC 9454 (Zen 4) KVM guest, Ubuntu 24.04; single-core
runs pinned with taskset, medians of 3-5 runs, raw logs in
data/.